在yii2中可以利用Performance Profiling来查看代码执行耗时情况,有利于分析页面的性能瓶颈,具体位置在底部的Yii Debugger中(debug模式下才有)。
使用很简单,只需要对代码进行埋点就行了,可以嵌套使用,代码示例如下:
example1:
Yii::beginProfile('countryQueryCost');
这里是代码部分
Yii::endProfile('countryQueryCost');
example2:
Yii::beginProfile('totalCost');
这里是代码部分
Yii::beginProfile('sumCost');
可以嵌套使用哦
Yii::endProfile('sumCost');
Yii::endProfile('totalCost');
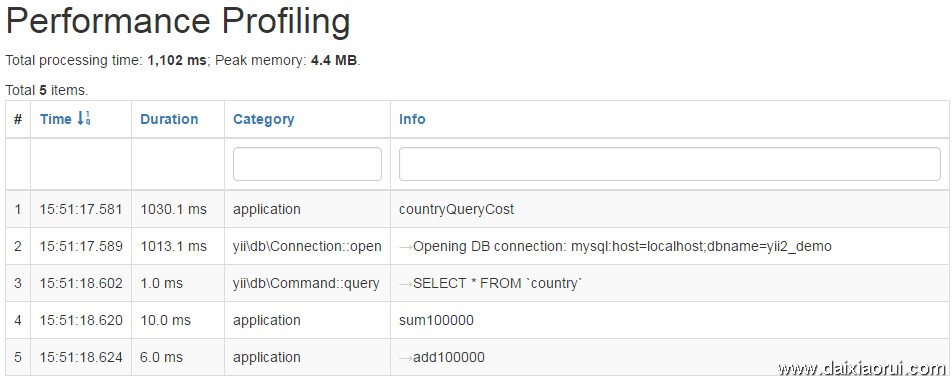
效果如下: